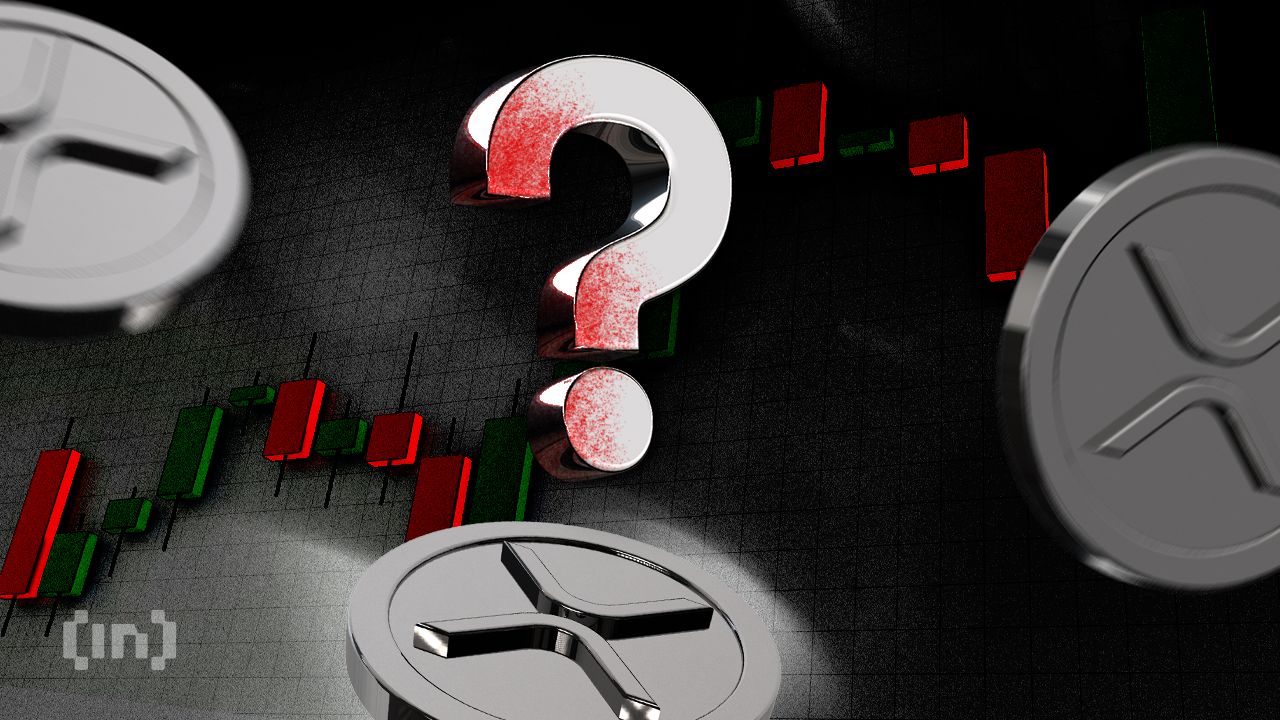
XRP Buying Pressure Surges 1,000% as Price Defies Bearish Pressure
Introduction: A Stealth Accumulation Phase Precedes Potential Breakout
In a display of underlying strength that has largely flown under the radar, XRP is exhibiting a powerful divergence between its on-chain activity and its spot price action. While the token's price has been contained within a familiar trading range, a seismic shift is occurring behind the scenes. Over a critical eight-day period, buying pressure for XRP surged by nearly 1,000%, a staggering increase that has allowed the asset to steadfastly defend its key support level against significant bearish technical signals. This massive accumulation, signaled by enormous exchange outflows, has set the stage for a potential explosive move. The entire bullish thesis now hinges on a decisive close above the $2.28 resistance level—a barrier that has capped every upside attempt since mid-November. If achieved, this could not only validate the immense buying pressure but also trigger a new leg higher toward the $2.55 zone.
Support Intact as the Falling Wedge Holds Firm
The technical structure for XRP has been defined by a falling wedge pattern—a typically bullish formation where the price moves lower within a narrowing range. This pattern often resolves with an upward breakout once buyer momentum overwhelms the selling pressure. For XRP, the lower boundary of this wedge, positioned at $2.14, has proven to be a formidable floor.
Since November 25, this support level has absorbed every attempted sell-off. Its resilience was put to the ultimate test with the completion of a bearish crossover between the 100-day and 200-day Exponential Moving Averages (EMA). An EMA is a type of moving average that places greater emphasis on recent price data, making its signals particularly relevant for short-term momentum. A bearish crossover between these two key EMAs typically exerts significant downward pressure on an asset's price. The fact that XRP price held firm at $2.14 despite this development is a strong technical indicator that sellers have lacked the conviction to force a breakdown, suggesting underlying strength that is not immediately apparent from the sideways price action alone.
On-Balance Volume (OBV) Breakout Hints at Underlying Strength
Concurrent with the steadfast price support, a key momentum indicator began flashing a bullish signal. The On-Balance Volume (OBV) line broke above its descending trendline, which had been in place since November 10. The OBV indicator is a cumulative tool that measures buying and selling pressure by adding volume on up days and subtracting it on down days. Its primary function is to confirm price trends or warn of potential reversals.
A breakout from a descending OBV trendline signifies that more volume is flowing into the asset on days when the price is increasing than is flowing out on declining days. This shift in volume dynamics often precedes a breakout in price, as it indicates accumulation is occurring beneath the market's surface. For the signal to be fully confirmed, however, the OBV needs to establish a higher high by surpassing its immediate resistance level of 6.64 billion. This would provide concrete evidence that the bullish volume momentum is sustainable.
Exchange Outflows Signal Heavy Accumulation: A 1,000% Surge in Buying Pressure
The most compelling data supporting a bullish outlook for XRP comes from on-chain flow metrics. The exchange net position change, which tracks whether tokens are moving onto or off of centralized exchanges, flipped deeply negative on November 19. Negative readings, often represented in red on data charts, indicate that tokens are being withdrawn from exchanges—a phenomenon widely interpreted as a sign of accumulation and a reduction in immediate selling supply.
The scale of this movement is what makes the current situation remarkable. On November 19, XRP outflows were recorded at approximately –59.32 million tokens. By November 27, that figure had ballooned to –650.45 million tokens. This represents an increase of almost 1,000% in just eight days. When outflows accelerate this dramatically while the price trades in a tight range, it strongly suggests that large-scale buyers, often referred to as "whales" or institutions, are systematically accumulating the asset without significantly moving the price. This massive withdrawal of liquidity from exchanges directly explains why the $2.14 support level remained unbroken even in the face of a bearish EMA crossover; the underlying demand was simply too strong for sellers to overcome.
Key Price Levels: The Battle at $2.28 and Beyond
Despite the overwhelmingly positive underlying signals, XRP’s price remains at a critical juncture, confined within a narrow range defined by two key levels.
- Resistance at $2.28: This is the most immediate and significant hurdle for the bulls. The $2.28 level has acted as a firm ceiling, blocking every attempt at an upside break since November 17. A daily close above this resistance, accompanied by rising volume, is the essential trigger for a potential bullish move. Such a breakout would confirm that the immense buying pressure and accumulation phase have successfully translated into upward price momentum.
- Target at $2.55: If a confirmed breakout above $2.28 occurs, the next major target for XRP price lies at $2.55. This level sits above the upper trendline of the current falling wedge pattern. A sustained move above $2.55 would not only achieve a measured move target from the wedge but could also flip the broader market structure to bullish, potentially confirming a longer-term trend reversal.
- Support at $2.14 and $2.02: On the flip side, failure to break above $2.28 keeps the token vulnerable to further consolidation or a pullback. The primary support to watch remains at $2.14, the lower boundary of the wedge that has proven so resilient. A breakdown below this level would shift focus to the next significant support near $2.02. Losing this secondary support would invalidate the current bullish setup and delay any potential breakout scenario.
Strategic Conclusion: Patience for Confirmation Amidst Bullish Signals
The current technical and on-chain setup for XRP leans decisively bullish. The evidence is clear: buying pressure has surged by nearly 1,000%, volume dynamics have shifted positively with the OBV breakout, and the price has repeatedly defended its crucial support level against bearish technical events.
For investors and traders, this creates a high-probability setup that requires patience and confirmation. The market is presenting a clear line in the sand at $2.28. All of the positive developments will remain latent potential until XRP can secure a decisive close above this level.
What to Watch Next:
- The $2.28 Close: Monitor daily closing prices closely. A confirmed break above this resistance with strong volume is the most critical signal for entering a new bullish phase.
- OBV Confirmation: Watch for the On-Balance Volume indicator to make a higher high above 6.64 billion to confirm the sustainability of the buying volume.
- Exchange Flow Data: Continue to track exchange net flows through platforms like Glassnode. A continuation of negative outflow readings would reinforce the accumulation thesis.
While broader cryptocurrency market conditions always play a role, XRP is demonstrating unique and powerful internal dynamics. The pieces are in place for a significant move; it now awaits that final technical trigger to unlock its next leg higher.
Disclaimer: In line with the Trust Project guidelines, this price analysis article is for informational purposes only and should not be considered financial or investment advice. The author is committed to accurate, unbiased reporting, but market conditions are subject to change without notice. Always conduct your own research and consult with a professional before making any financial decisions.